Building AWS Cost Monitoring Dashboards

Keeping AWS costs in check can be challenging, but creating custom dashboards makes it easier to track spending, spot anomalies, and optimize resources. Here's what you need to know:
-
What Are AWS Cost Monitoring Dashboards?
These dashboards are single-page tools that visualize your AWS spending through widgets like cost summaries, budget trackers, and savings opportunities. -
Why Monitor Costs?
Without monitoring, costs can spiral out of control. Dashboards help identify trends, prevent overspending, and optimize Reserved Instances and Savings Plans. -
How to Build One:
- Enable AWS Cost Explorer to access historical and forecasted spending data.
- Set up IAM permissions for dashboard access.
- Use widgets like Cost Summary, Cost Breakdown, and Savings Opportunities to track key metrics.
- Share dashboards across teams using AWS Resource Access Manager (RAM).
-
Best Practices:
Combine widgets for deeper insights, share dashboards for consistent reporting, and consider automation tools like Opsima to streamline cost optimizations.
With a functional dashboard, you can monitor spending, reduce waste, and make informed decisions about your AWS resources.
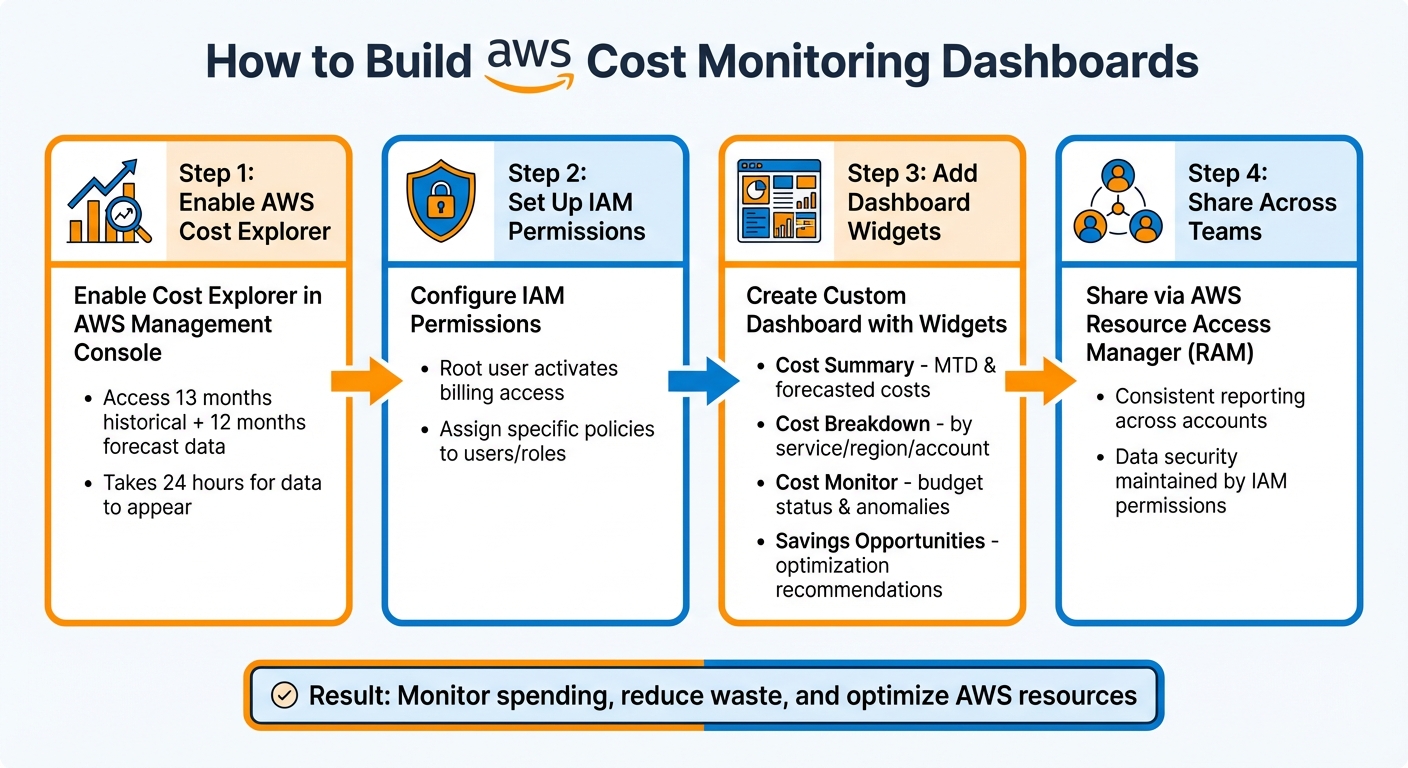
4-Step Process to Build AWS Cost Monitoring Dashboards
Build a Cost and Usage Dashboard in AWS
Prerequisites for Setting Up Cost Dashboards
Before diving into creating your first cost monitoring dashboard, you'll need to complete a few key steps. These steps ensure you have access to the necessary data and permissions for building, viewing, and sharing dashboards across your organization.
Enable AWS Cost Explorer
To access your cost and usage data, you'll need to enable Cost Explorer. Start by signing in to the AWS Management Console, navigating to the Billing and Cost Management console, selecting Cost Explorer from the navigation pane, and clicking Launch Cost Explorer. Keep in mind, this step must be done through the console - there’s no API option for enabling Cost Explorer.
Once enabled, AWS will compile cost data for the current month and the past 13 months, while also providing a forecast for the next 12 months. It takes up to 24 hours for current month data to appear, so make sure you enable it at least a day before you start building your dashboard.
If your account is part of an AWS Organization, only the management account can enable Cost Explorer. The management account also decides whether member accounts can access this feature. Additionally, enabling Cost Explorer automatically sets up Cost Anomaly Detection with default alerts for spend exceeding $100 or 40% of expected spend.
Set Up IAM Permissions
By default, IAM users and roles do not have access to the Billing and Cost Management console, even if they have admin privileges. To change this, the root user must activate access via the IAM User and Role Access to Billing Information section on the Account page.
Once access is activated, you can assign specific IAM policies to users or roles to enable billing features. For example, to view dashboard widgets or receive recommendations, users need permissions like bcm-recommended-actions:ListRecommendedActions. If your account was created before March 6, 2023, you might need to update policies using AWS’s bulk policy migrator scripts to align with the latest billing views.
In an AWS Organization, the management account has full visibility into all costs. By default, member accounts can view only their own data, but the management account can adjust this through Cost Management Preferences.
Configure AWS Resource Access Manager (RAM)
To share cost monitoring dashboards across accounts, you’ll use AWS Resource Access Manager (RAM). This tool allows the management account to create centralized, standardized dashboards and distribute them to member accounts, ensuring consistent reporting.
To get started, enable AWS RAM sharing within your AWS Organization and make sure the management account has the appropriate permissions, such as bcm-dashboards. While member accounts don’t need specific permissions to view shared dashboards, they must have access to the underlying cost and usage data APIs to see detailed widget information.
Once these steps are complete, you’ll be ready to create and customize your AWS cost monitoring dashboard.
How to Build AWS Cost Monitoring Dashboards
Access the AWS Billing and Cost Management Console
Start by navigating to https://console.aws.amazon.com/costmanagement/. Make sure you have the necessary IAM permissions set up beforehand, as these are essential to access and manage dashboards. Without the proper permissions, you won’t be able to view or create dashboards.
Keep in mind that all dates and times on the dashboard are displayed in Coordinated Universal Time (UTC). This is important when analyzing time-sensitive data. Once you’re in, you can begin creating your dashboard to visualize cost-related data.
Create a Custom Dashboard
After accessing the console, you’re ready to build your custom dashboard. These dashboards can include widgets that show data from Cost Explorer, Savings Plans, and Reserved Instances.
Start by selecting the option to create a new dashboard. Give it a clear and descriptive name that reflects its purpose, such as "Q1 2026 Cost Tracking" or "Production Environment Costs." Adding a short description can also help your team understand the dashboard’s focus. Enable the autosave feature to make sure your changes are saved automatically as you work. Once your dashboard is named, you can begin adding widgets to monitor key metrics.
Add and Configure Widgets
Widgets are the building blocks of your dashboard, allowing you to track various spending metrics. Here’s how you can use some of the most useful widgets:
- Cost Summary: Displays your month-to-date (MTD) estimated costs, forecasted month-end costs, and last month’s comparison. This widget is great for getting a quick overview of your spending.
- Cost Breakdown: Lets you drill down into costs by dimensions like Service, AWS Region, Account, cost allocation tag, or cost category. This helps identify specific cost drivers.
- Cost Monitor: Tracks budget statuses (e.g., OK, Over budget, or Setup required) and flags cost anomalies for the current month. This widget is essential for proactive budget monitoring.
- Savings Opportunities: Highlights potential monthly savings by showing recommendations from the Cost Optimization Hub, such as rightsizing instances or purchasing Savings Plans.
You can rearrange widgets by dragging and dropping them or resize charts to suit your needs. If the layout becomes messy, use the "Reset layout" option to return to the default arrangement. For deeper insights, click on any widget to apply advanced filters.
Here’s a quick overview of key widgets and their uses:
| Widget Type | Key Metrics | Primary Use Case | Configuration Options |
|---|---|---|---|
| Cost Summary | MTD costs, Forecasted month-end, Last month comparison | High-level monthly spending overview | View details |
| Cost Breakdown | Costs by dimension (Service, Region, Account, etc.) | Identifying primary cost drivers | Group by dimension |
| Cost Monitor | Budget status, Cost anomaly alerts | Tracking budget compliance and spend spikes | Connects to Budgets/Anomaly Alerts |
| Savings Opportunities | Estimated monthly savings, Rightsizing, RI/SP | Identifying immediate cost-reduction actions | Opt-in via Cost Optimization Hub |
| Top Trends | Top 10 cost variations (percentage and absolute) | Analyzing significant month-over-month changes | Compare view |
| Recommended Actions | Priority-ranked optimization tasks | Implementing financial management best practices | Dismiss or load more |
The Recommended Actions widget is particularly useful for addressing critical issues like payment failures or budget overruns. Meanwhile, the Top Trends widget automatically identifies the top 10 cost variations between the last two months, sorted by absolute dollar differences, making it easy to spot major spending changes.
Best Practices for Cost Monitoring
Combine Widgets for Better Insights
Mixing and matching widget types can give you a clearer picture of your expenses. For instance, instead of analyzing Savings Plans coverage on its own, pair it with an EC2 spend breakdown by instance type. This approach helps you see if your commitments align with your most expensive workloads.
Another effective combo is using the Cost Monitor widget alongside Top Trends. If the Cost Monitor flags an anomaly, the Top Trends widget can pinpoint whether a specific service or region is behind the spike. Similarly, combining the Savings Opportunities widget with a service-specific cost breakdown allows you to focus your optimization efforts. For example, if a particular service dominates your monthly spending, prioritize rightsizing for that service first.
"Effective cloud cost reporting is critical: you cannot improve what you cannot measure." - Bowen Wang, Principal Product Marketing Manager, AWS
Share Dashboards Across Accounts
Once you've set up effective widget combinations, sharing dashboards can streamline cost tracking across teams. For organizations managing multiple accounts, use AWS Resource Access Manager (RAM) to share dashboard configurations. This approach maintains consistency in reporting while ensuring data security.
When you share a dashboard, only the widget configurations (like metrics, filters, and layout) are transmitted. Each recipient's view is limited by their IAM permissions. For instance, finance teams can access organization-wide costs, while engineering teams see only their account-specific data.
To implement this, create a template dashboard in your management account and share it across member accounts. This ensures every team has a consistent reporting structure while viewing only relevant data. The result? Better cost visibility and more informed decision-making across your organization.
Use Opsima for Automated Cost Optimization
While dashboards help you identify spending patterns, automation tools like Opsima take it a step further by managing cost optimizations for you. For example, the Savings Opportunities widget might highlight areas to save, but Opsima actively adjusts Savings Plans and Reserved Instances as your usage evolves.
Opsima works across multiple AWS services, including EC2, Lambda, RDS, ElastiCache, OpenSearch, and SageMaker. It can reduce AWS bills by up to 40% without altering your infrastructure or accessing application data. With a quick 15-minute onboarding process, the platform takes on the risk of managing commitments while keeping your cloud operations flexible.
In short, your dashboard helps you spot cost-saving opportunities, and Opsima ensures those opportunities are realized - continuously and automatically.
Conclusion
Start by enabling AWS Cost Explorer and setting up the necessary IAM permissions. Once that's done, head to the Billing and Cost Management console to create your custom dashboard. Add widgets that align with your organization’s priorities - whether it’s a mix of KPI cards, trend charts, or other visual tools that give you a clear view of your spending patterns.
After setup, consistent monitoring becomes essential to avoid overspending. Your dashboard helps you identify trends and anomalies, allowing you to act before small issues turn into costly problems. As Bowen Wang, Principal Product Marketing Manager at AWS, explains:
"Real time and accurate cost reporting is so important because it enables your team to make better decisions and prioritize actions".
To take it a step further, automation can amplify your savings. While manual adjustments to Savings Opportunities and commitments are possible, tools like Opsima simplify the process by dynamically managing cost reductions across your AWS environment. Build your dashboard, keep an eye on it, and let automation tools handle optimizations for ongoing savings.
FAQs
How can I keep my AWS cost monitoring dashboard updated with the latest spending information?
To keep your AWS cost monitoring dashboard current with the latest spending information, take advantage of AWS tools that allow for real-time or scheduled data updates. Tools like AWS Cost Explorer and Amazon QuickSight can be set to automatically refresh data, giving you continuous access to up-to-date spending insights without manual intervention.
With Amazon QuickSight, you have the flexibility to schedule data refreshes at regular intervals or update your data manually whenever needed. Additionally, AWS Data Exports can deliver detailed cost and usage data on a daily or hourly basis, ensuring you have timely and precise information. By setting up frequent updates and scheduled refreshes, you can maintain an accurate and reliable view of your AWS spending.
What are the advantages of using AWS Resource Access Manager (RAM) to share cost monitoring dashboards?
AWS Resource Access Manager (RAM) simplifies the process of securely sharing cost monitoring dashboards with your teams or stakeholders - whether they're part of your organization or external partners. With RAM, you can provide access to critical cost and usage data without giving users direct access to your AWS account.
This method promotes better collaboration while keeping sensitive account permissions tightly controlled, ensuring that only authorized individuals can access your data.
How can automation tools like Opsima improve AWS cost optimization compared to manual monitoring?
Automation tools like Opsima simplify AWS cost management by removing the need for constant manual oversight. While manual dashboards - like those created with AWS Cost Explorer or Amazon QuickSight - are useful for visualizing and analyzing spending, they depend heavily on user input and interpretation.
Opsima takes a different approach by automating critical tasks, such as managing cloud resource commitments, tracking usage in real-time, and dynamically adjusting resources to prevent overspending. This not only reduces the risk of human error but also allows for faster responses to cost anomalies. Businesses using tools like Opsima can cut their AWS bills by up to 40%. By automating cost management, these tools make the process more efficient and scalable, giving teams more time to focus on other important tasks.