How to Analyze AWS Commitment Trends Over Time


AWS commitments like Savings Plans and Reserved Instances can reduce cloud costs by up to 72%, but they require careful planning. Misaligned commitments can lead to wasted spending or higher costs during unexpected usage spikes. Here's how you can manage them effectively:
- Analyze Historical Data: Use up to 38 months of AWS data to track trends and identify stable usage patterns. For detailed insights, review daily resource-level data from the past 14 days.
- Key Metrics: Focus on Coverage (percentage of spend covered by commitments), Utilization (how much of your commitment is used), and Effective Savings Rate (ESR) to measure savings.
- Monitor in Real-Time: Tools like AWS Cost Explorer and dashboards help track performance and spot anomalies. Set alerts for utilization drops or expiring commitments.
- Plan Smarter: Avoid overcommitting by identifying baseline usage and seasonal patterns. Use adaptive laddering to make smaller, recurring purchases instead of large, long-term commitments.
- Leverage Automation: Tools like Opsima optimize commitments, saving up to 40% on costs without manual effort.
Key Metrics for AWS Commitments
AWS Commitment Key Metrics: Coverage, Utilization, and ESR Benchmarks
Tracking the right metrics can transform AWS commitment management from a guessing game into a precise, data-driven process. Here are three key measurements that reveal whether your commitments are delivering value or quietly eating into your budget.
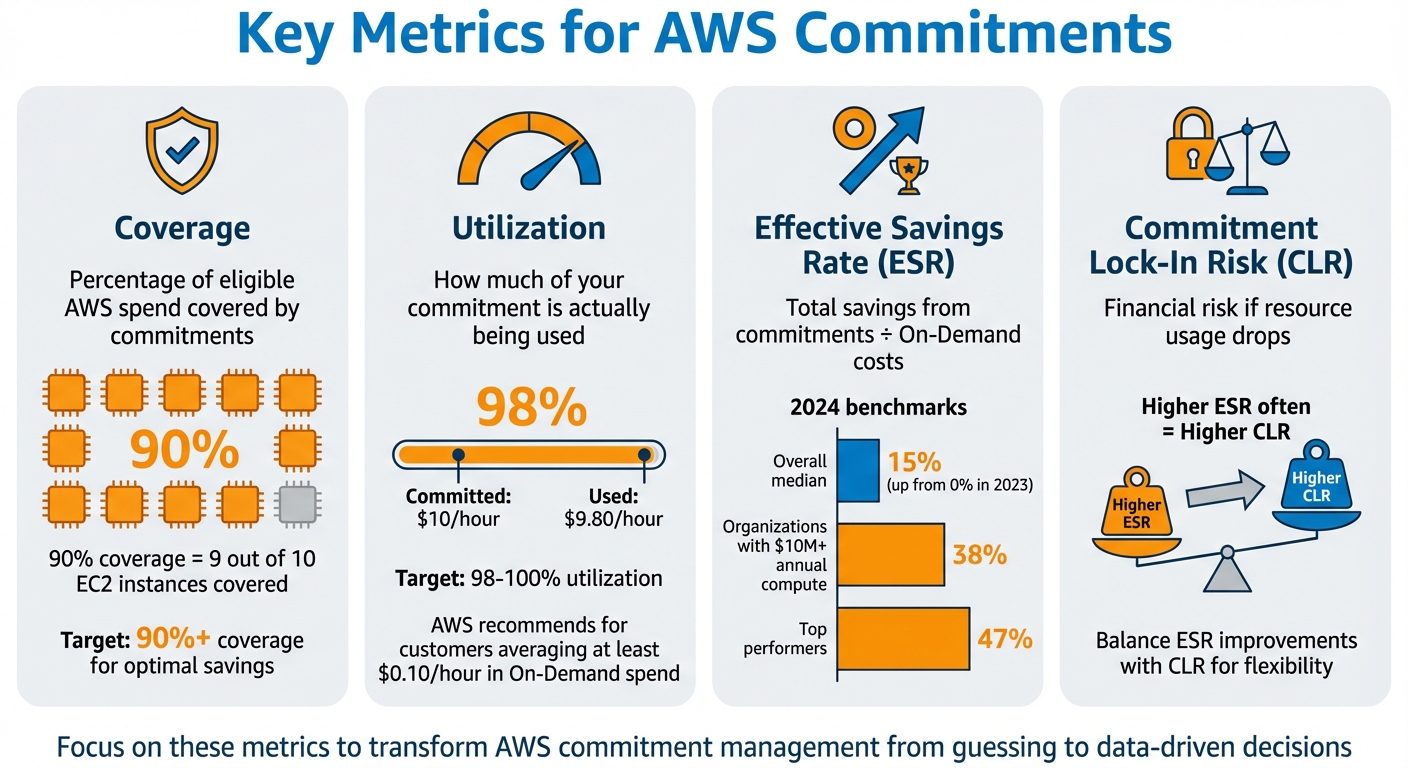
Coverage reflects the percentage of your eligible AWS spend that's shielded by commitments like Savings Plans or Reserved Instances. For example, if nine out of ten EC2 instances costing $1.00/hour are covered by a Savings Plan, your coverage rate is 90%. That uncovered 10% is still charged at full On-Demand rates - a clear area where you could save more.
Utilization indicates how much of your commitment is actually being used. If this figure drops significantly below 100%, it signals wasted spending. For instance, if you've committed to $10/hour but only apply $9.80 of that to eligible usage, your utilization rate is 98%. AWS even tailors recommendations for customers averaging at least $0.10/hour in On-Demand spend during the selected lookback period, making this metric crucial for workloads of all sizes.
Effective Savings Rate (ESR) combines coverage and utilization to measure your overall return on investment. It's calculated by dividing the total savings from your commitments by what you would have spent at On-Demand rates. In 2024, organizations with over $10M in annual compute usage saw a median ESR of 38%, while the overall median rose from 0% in 2023 to 15%. Top performers reached 47%.
Commitment Lock-In Risk (CLR) assesses the financial risk tied to your commitments if resource usage drops. A higher ESR often comes with a higher CLR, especially for longer-term commitments like three-year plans. Large commitments rely on steady usage, so if demand falls, you're left paying for discounts you can't use. Balancing ESR improvements with CLR is key to staying flexible as your infrastructure evolves.
Setting Up Real-Time Commitment Monitoring
Real-time monitoring transforms reviews into active, on-the-spot adjustments. By identifying utilization drops or coverage gaps early, you can make changes quickly, preventing unnecessary spending from piling up. This method lays the groundwork for more detailed insights via tools like Cost Explorer, dashboards, and alerts.
### Opsima vs AWS Cost Explorer
AWS Cost Explorer is your go-to tool for tracking commitment performance. While "real-time" in this context means data updated at least once every 24 hours, you can get closer to live insights by enabling hourly and resource-level granularity in the settings. This provides data from the past 14 days. To dive deeper, head to the Billing and Cost Management console, click Savings Plans > Inventory, choose a Savings Plan ID, and then select View utilization report. Use the Group by filter to pinpoint anomalies in specific services. For a clearer breakdown of commitment costs, switch to Net Amortized Costs, which spreads out all fees evenly.
Building Commitment Dashboards
AWS Billing and Cost Management Dashboards allow you to create custom widgets that combine data from Cost Explorer with metrics for Savings Plans and Reserved Instance coverage and utilization. Pin these dashboards for quick access to your most important performance stats. For advanced visualizations, you can use AWS's pre-built Cost and Usage Dashboard powered by Amazon QuickSight (available with Enterprise Edition). To set this up, go to Data Exports in the Billing and Cost Management console, click Create, select the QuickSight export type, configure your S3 bucket for data storage, and authorize QuickSight with a service role. These dashboards should focus on burn-down rates - how quickly your commitment value is being used - and account-level details to see which teams or projects are driving usage.
Configuring Alerts for Coverage and Utilization
While dashboards provide a snapshot of your data, alerts ensure you can act immediately. Use AWS Budgets to set up automated notifications through Amazon Simple Notification Service (SNS) for scenarios like utilization dropping below a set percentage or when coverage gaps appear. For instance, if your $10/hour commitment only covers $8/hour of usage, your utilization rate is 80%. Setting an alert at 85% would flag this early. Base your thresholds on historical usage patterns from 7, 30, or 60-day lookbacks in Cost Explorer.
You can also subscribe to Savings Plans alerts to get notified before a commitment expires, giving you time to plan renewals and avoid On-Demand pricing. Additionally, AWS introduced a purchase guardrail alert on January 29, 2024, which warns you if you attempt to add a Savings Plan with a commitment higher than the recommended value. For unusual spending patterns, enable Cost Anomaly Detection. This feature sends daily alerts for anomalies, such as spending that exceeds $100 and 40% of expected costs, without any initial charge.
"Use alerts to notify you before your Savings Plan expires so that you can plan ahead for a new commitment." - Vivek Appala, Sr. Technical Account Manager, AWS
Analyzing Historical Commitment Data
Once you’ve set up real-time monitoring, the next step is to dig into historical data. This allows you to uncover usage patterns and pinpoint savings opportunities. AWS Cost Explorer offers up to 38 months of historical data with monthly granularity, making it easier to analyze trends over multiple years and compare year-over-year usage changes to see how your needs have evolved.
Determining Baseline Usage
Your baseline represents the daily usage that remains consistent over time. To identify this, use AWS Cost Explorer to group data by Purchase Option. This helps isolate on-demand usage that’s been running continuously (24x7) over the past 30–60 days. Such stable usage is ideal for commitment-based discounts.
A key technique here is trough analysis, which identifies the lowest consistent usage level. Committing to this minimum ensures full utilization but may limit potential savings. For example, a trough commitment might result in 100% utilization with a 24.6% Effective Savings Rate (ESR). On the other hand, committing slightly above this level could raise the ESR to 37%, offering greater overall savings.
To solidify your baseline, analyze 6–12 month rolling windows for consistent patterns. Then, double-check the last 14 days of daily data to rule out anomalies like one-off usage spikes. As Muskan Goel, Content Lead at ProsperOps, aptly states:
"Waiting for a perfect baseline means postponing savings indefinitely".
Once your baseline is clear, shift your focus to identifying recurring seasonal and cyclical trends.
Finding Seasonal and Cyclical Patterns
Seasonal patterns emerge as predictable fluctuations above your baseline. Think of holiday sales surges or end-of-quarter reporting peaks. To spot these, use Cost Explorer to filter by specific Usage Type Groups (like "Running Hours") and review daily usage patterns, separate from cost variations. Look for recurring trends by hour, day, or month to understand when your workloads scale up or down.
For instance, with a Compute Savings Plan offering a 29% discount, the break-even point is typically reached after about eight and a half months of consistent usage. If your workload shows predictable elasticity, consider committing slightly above your lowest observed usage point. While this might reduce utilization slightly, it can maximize your overall Effective Savings Rate.
The next step is to assess historical utilization to avoid overcommitting.
Identifying Overcommitment Risks
Overcommitment occurs when the capacity you’ve purchased exceeds your actual usage. To spot this, review historical utilization reports for zombie commitments - idle capacities that aren’t being used. Year-over-year comparisons, such as evaluating October 2023 against October 2022, can help you understand shifts in spending while accounting for seasonal trends.
Be mindful of recent infrastructure changes. If you’ve switched instance families or migrated workloads, which requires choosing the right EC2 instances for your new environment, exclude historical data from before the transition to ensure accurate commitment recommendations. This helps prevent decisions based on outdated usage patterns.
Improving Commitment Strategies with Trend Analysis
By analyzing historical and real-time data, you can refine your commitment strategy to strike a balance between maximizing savings and managing risk. Once you’ve identified your baseline usage and seasonal patterns, this data can help you improve your Effective Savings Rate (ESR) while keeping Commitment Lock-In Risk (CLR) low enough to adapt as your infrastructure evolves.
Layering Commitments Over Time
Instead of making large, one-time purchases, consider spreading out smaller, recurring purchases throughout the year. This method, known as adaptive laddering, creates rolling expiration windows, giving you more flexibility to adjust as workloads change.
For instance, switching from annual bulk purchases to quarterly laddered purchases can lower your Commitment Lock-In Risk from 12 months to about 7.5 months. Taking it a step further with automated monthly laddering can reduce that risk to around 6.5 months while also improving your ESR. The key here is shortening your forecasting window from over a year to roughly three months.
"Rather than making large, infrequent purchases, adopt a 'rolling' strategy. Smaller, recurring purchases allow you to adapt more easily to usage changes, reduce long-term lock-in, and maintain more consistent coverage".
- Adam Richter, Sr. Optimization Solutions Architect at AWS
A good starting point is to commit to only 50–60% of your verified baseline usage. After monitoring for one quarter, you can add another 20–30% based on proven trends. This phased approach reduces the risk of overcommitting while letting you validate your usage patterns.
Once you’ve implemented layered commitments, stay proactive and adjust as your usage evolves.
Modifying Commitments Based on Usage Changes
Building on the adaptive laddering strategy, it’s essential to monitor usage changes and adjust your plans dynamically. If utilization drops, act quickly. This could indicate resource shutdowns, workload migrations, or mismatched purchases, such as the wrong region or instance type. For Reserved Instances, you can use the "Modify" feature to adjust size or region, or "Exchange" Convertible RIs to align with new instance families.
Set up alerts for 7 to 30 days before commitments expire. This gives you time to reassess based on recent trends rather than automatically renewing. If usage has declined, it might be better to let the commitment lapse instead of renewing blindly. While traditional analysis often focuses on 100% utilization, committing slightly into cyclical usage ranges can still improve your ESR, even if utilization drops to 86.5%.
Using Spot Instances for Variable Workloads
Before locking into 1-year or 3-year plans, evaluate whether certain workloads can run on Spot Instances. Spot Instances can save 70%–90% compared to On-Demand rates, often offering better savings than Savings Plans, which provide up to 72% discounts.
Use tools like Cost Explorer to analyze hourly usage trends and identify workloads that are elastic, short-duration, or fault-tolerant. Common candidates for Spot Instances include batch processing jobs, CI/CD pipelines, and machine learning training tasks. These types of workloads can handle interruptions and don’t require the continuous availability that would justify commitment-based discounts.
For stable, always-on workloads, commitments are generally a better fit. But for variable workloads that fluctuate throughout the day or week, Spot Instances provide significant savings without the risks of long-term lock-in. A hybrid approach - using commitments for your steady baseline and Spot Instances for peaks - can help you achieve cost efficiency while maintaining operational flexibility.
Automated tools like Opsima can simplify these strategies even further, continuously analyzing trends and optimizing your AWS commitments without requiring manual effort.
Automating Commitment Management
As AWS environments grow, managing commitments manually becomes increasingly unrealistic. Tasks like analyzing usage trends, predicting future needs, and timing purchases across various services demand constant vigilance. Automation steps in to handle this complexity, continuously monitoring usage patterns and adjusting commitments in real time for better efficiency.
Continuous Trend Analysis and Adjustment
Automated tools take a proactive approach by analyzing your usage data daily rather than relying on periodic reviews. This real-time monitoring enables automated rebalancing to adjust commitments as workloads shift.
When setting up automated analysis, defining the right lookback period is key. Most tools let you specify windows - like the last 30 or 60 days - to focus on recent trends while filtering out temporary spikes. Additionally, when preparing for renewals, exclude Savings Plans that expire within the next 90 days to ensure accurate modeling of new commitments.
This continuous adjustment process not only keeps your commitments aligned with changing workloads but also significantly reduces the need for manual oversight.
Reducing Manual Work
Automation eliminates many of the tedious tasks involved in commitment management. For instance, it handles the selection of instance types, terms, and payment options directly through AWS without requiring manual intervention. By cutting out these time-consuming processes, your team can focus on enhancing applications instead of managing commitments. Some platforms have demonstrated the ability to scale automation effectively, managing over $2 billion in annual AWS spend across organizations of various sizes.
Additionally, many of these tools align their pricing with your savings, charging a percentage of the cost reductions achieved rather than fixed fees. This ensures their incentives match your goal of lowering expenses.
Managing Commitments Across AWS Services
Automation doesn’t just optimize a single area; it works across your entire AWS environment for consistent cost efficiency. Compute Savings Plans can cover services like EC2, Lambda, and Fargate, while Database Savings Plans typically cover RDS. Automated tools leverage the AWS Cost Explorer API to gather purchase analyses and recommendations, eliminating the need for manual console use.
By integrating all AWS services into one automated system, you can ensure your cost-saving strategy stays in sync with actual usage patterns. Platforms like Opsima specialize in this, optimizing commitments across major services while incorporating existing Reserved Instances and Savings Plans. Opsima claims to reduce cloud spending by up to 40% through real-time optimization. It also preserves flexibility as your usage evolves, operates without accessing customer data, and requires no infrastructure changes. Setup is quick - around 15 minutes - and provides detailed insights into your savings and risks through user-friendly dashboards.
Analysis can be conducted at the management account level to maximize savings across your AWS Organization or at individual linked account levels for more detailed control.
Conclusion
Optimizing AWS commitments isn’t just about trimming costs - it’s about creating a flexible strategy that evolves alongside your infrastructure. By combining precise metrics, historical trends, and automation, you can ensure your cloud spending stays efficient and effective.
Focus on Coverage to monitor discounted compute spend and Utilization to confirm full use of commitments. Aim for 98–100% utilization and 90%+ coverage to maximize savings. Additionally, use your Effective Savings Rate to gauge the actual discounts achieved across your entire AWS environment.
Historical data plays a key role in this process. Multi-year data helps you establish accurate baselines, identify meaningful trends, and set lookback periods that filter out anomalies. Scheduling renewals up to 90 days in advance ensures you’re always prepared.
Automation takes commitment management to the next level. Tools like Opsima streamline daily usage analysis, layer commitments across services (EC2, ECS/Fargate, Lambda, RDS), and make real-time adjustments. With a quick 15-minute setup and zero access to customer data, Opsima can cut cloud costs by up to 40% while preserving flexibility.
FAQs
How do I choose the right lookback period for commitments?
When choosing a lookback period, aim for one that aligns with your usual usage patterns and any recent adjustments, like transitioning to optimized EC2 instances. Steer clear of periods that are too short, as they might not provide enough data, or too long, which could include outdated trends. AWS typically suggests using a lookback period from the past 60 days to ensure your commitment decisions are grounded in relevant and current usage data.
What’s a good way to balance savings with lock-in risk?
To manage savings while minimizing the risk of being locked into AWS commitments, consider a rolling Savings Plans strategy. This method involves staggering your commitments over shorter terms, which helps reduce the risks associated with unexpected changes in workloads.
Make it a habit to regularly review your usage patterns and conduct cost analyses. This ensures your commitments align closely with your actual needs. By continuously monitoring your usage, you can strike a balance - maximizing savings while keeping the flexibility needed to adapt to shifting workload demands.
When should I use Spot Instances instead of commitments?
When your workloads are fault-tolerant, flexible, stateless, or short-term, Spot Instances are a great choice. They’re designed to handle interruptions, and the cost savings are huge - up to 90% compared to On-Demand prices. This makes them perfect for tasks like batch processing, big data analysis, or even adaptable development environments.