5 Steps to Forecast AWS Costs for Dynamic Scaling


Dynamic scaling in AWS automatically adjusts resources to meet changing demand, but predicting costs can be challenging. To forecast AWS costs effectively, follow these five steps:
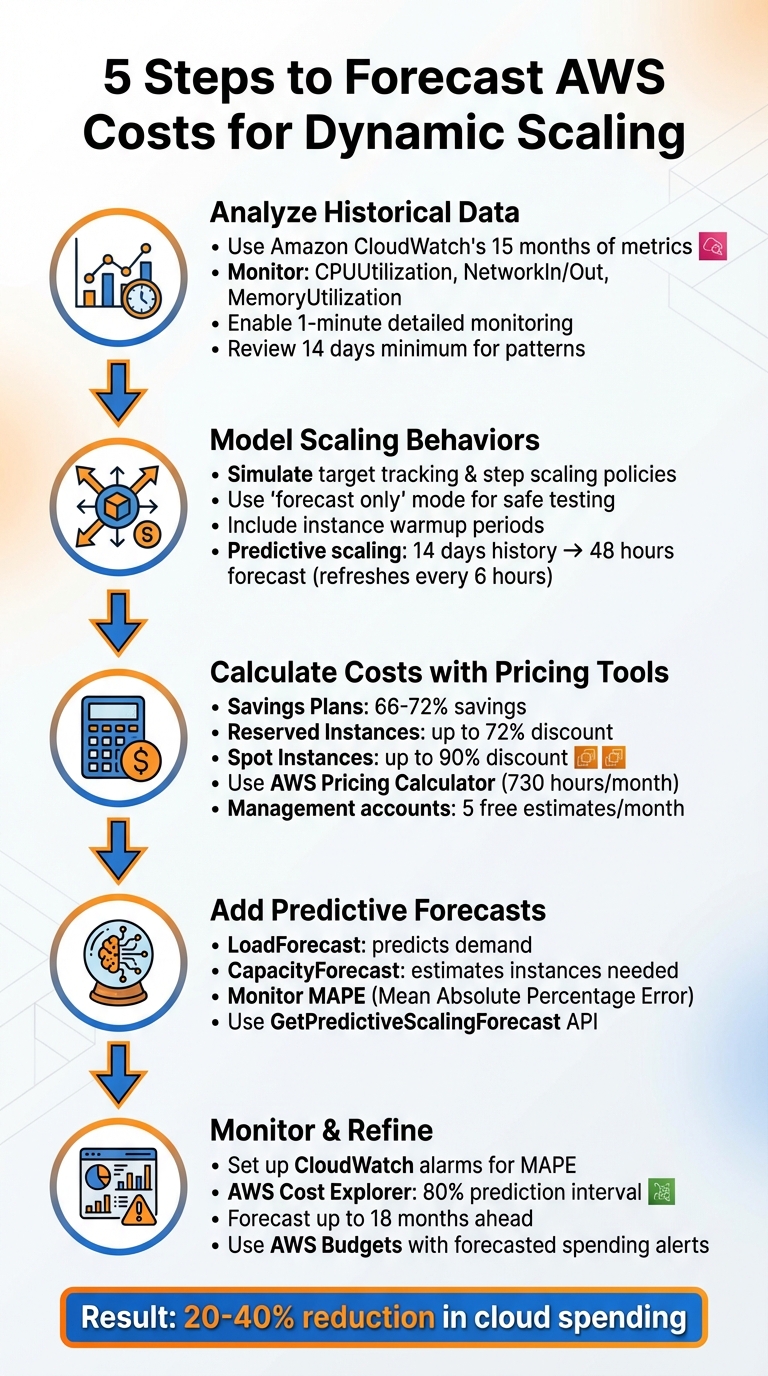
- Analyze Historical Data: Use Amazon CloudWatch's 15 months of metrics to identify trends and scaling triggers like CPU or memory usage.
- Simulate Scaling Policies: Test how target tracking and step scaling policies impact resource usage and costs using "forecast only" mode.
- Estimate Costs with AWS Pricing Tools: Combine baseline usage with AWS pricing models (e.g., Savings Plans, Spot Instances) using the AWS Pricing Calculator.
- Incorporate Predictive Scaling: Leverage machine learning forecasts for upcoming demand spikes to plan ahead.
- Monitor and Refine Forecasts: Use tools like AWS Cost Explorer and CloudWatch alarms to validate and adjust your predictions regularly.
5-Step Framework for Forecasting AWS Costs with Dynamic Scaling
AWS Cost Explorer: Analyze & Forecast Cloud Spending | AWS Management Tutorial
Step 1: Review Historical Usage Data in CloudWatch
Amazon CloudWatch keeps 15 months of historical metrics, giving you a solid foundation for analyzing past performance trends. To forecast costs effectively, start by retrieving this historical data and examining the metrics that trigger scaling events.
Review Key Metrics for Dynamic Scaling
The metrics you need to monitor will vary based on the specific AWS services you’re using. For EC2 Auto Scaling groups, focus on metrics like CPUUtilization, NetworkIn, and NetworkOut in the AWS/EC2 namespace. If you’re running containerized workloads on ECS, pay close attention to CPUUtilization and MemoryUtilization under AWS/ECS, as these are critical for predicting scaling events that could influence costs. For applications using an Application Load Balancer, track RequestCountPerTarget in the AWS/ApplicationELB namespace to understand how traffic is distributed across instances.
To dive deeper, access the relevant CloudWatch namespace and graph the metrics that trigger scaling. Enable 1-minute detailed monitoring to capture short-lived spikes that might otherwise go unnoticed.
Find Patterns and Trends
Look at the past 14 days of data to identify recurring patterns in daily and weekly traffic. For example, you might notice higher usage during business hours (like 9:00 AM–5:00 PM) and lower activity overnight or on weekends. E-commerce platforms often experience weekly spikes on Fridays or seasonal increases during holiday shopping periods.
When setting up predictive scaling, AWS needs at least 24 hours of historical data to generate its first forecast. However, using 14 days of data leads to much more accurate predictions. Initially, try running predictive scaling in "forecast only" mode to compare predictions with actual historical trends. This helps you fine-tune which metrics truly reflect your application’s load.
Make sure to document these patterns - they’ll play a crucial role in shaping your scaling model in the next steps.
Step 2: Model Scaling Behaviors and Policies
After reviewing your historical data, the next step is to simulate how your resources scale under different conditions. This process connects past trends to future cost estimates, helping you anticipate when resources will need to scale up or down.
Simulate Target Tracking and Step Scaling Policies
Target tracking policies are designed to adjust resource capacity to maintain specific metrics, like keeping CPU usage at 50%. When simulating this behavior, assume that capacity and metric values have an inverse relationship: as capacity increases, the metric value decreases.
Step scaling policies, on the other hand, make discrete adjustments to capacity based on the extent to which a CloudWatch alarm is breached. If you're testing multiple policies simultaneously, AWS will always apply the policy that results in the highest capacity for both scaling out and scaling in.
To experiment without affecting your live setup, use "forecast only" mode. This lets you generate capacity forecasts without actually launching or terminating instances. It’s a safe way to evaluate different scaling policies and their potential impact on availability and costs. Be sure to include an instance warmup period in your model. Instances that are still warming up won't contribute to the aggregated metrics used to trigger scaling decisions.
These simulations provide the foundation for more accurate cost calculations in later steps.
Use Predictive Scaling for Planning
While dynamic scaling policies react to real-time metrics, predictive scaling takes a forward-looking approach. It uses machine learning to analyze 14 days of historical data and forecasts capacity needs for the next 48 hours. These forecasts refresh every 6 hours using the latest CloudWatch data.
The key difference lies in timing. Dynamic scaling waits for a metric threshold to be breached - similar to how a thermostat reacts to a temperature change. Predictive scaling, however, forecasts demand ahead of time, allowing resources to be allocated proactively. This is especially useful for applications with long startup times, as you can set a scheduling buffer to launch instances early.
| Feature | Dynamic Scaling (Target/Step) | Predictive Scaling |
|---|---|---|
| Approach | Reactive (responds to real-time data) | Proactive (uses ML forecasts) |
| Data Source | Live CloudWatch alarms/metrics | 14-day historical patterns |
| Primary Benefit | Manages unexpected, immediate demand | Prepares for cyclical or predictable patterns |
| Timing | Scales after threshold is breached | Scales before demand peaks |
| Scale-In | Supported (removes idle capacity) | Not supported (requires dynamic policy) |
Predictive scaling doesn’t handle scale-in actions on its own. To reduce capacity when demand drops, you'll need to combine it with a dynamic scaling policy. Before activating predictive scaling, run it in "forecast only" mode for a few days. This allows you to compare the "actual observed capacity" against the "predicted capacity" and make any necessary adjustments.
Step 3: Calculate Costs Using AWS Pricing Tools
After mapping out your scaling behaviors, the next step is turning your usage projections into cost estimates. Using your scaling simulations as a foundation, match your forecasted usage with AWS pricing models to get a clearer picture of your potential expenses.
Break Down Costs by Pricing Model
To optimize costs, it's important to separate your steady baseline usage from the fluctuating demand caused by scaling. Baseline usage can benefit from long-term commitment plans, while scaling demands are better suited to flexible options.
- On-Demand Instances: These are the go-to pay-as-you-go option, perfect for handling spikes in demand where capacity needs can shift quickly.
- Savings Plans: By committing to a specific hourly spend (e.g., $50/hour) for one or three years, you can save between 66% and 72%.
- Reserved Instances: While Savings Plans are often favored for EC2 due to their flexibility, Reserved Instances are still a solid choice for services like RDS, ElastiCache, and Redshift, offering up to 72% discounts for one- or three-year commitments.
- Spot Instances: These provide access to unused compute capacity at discounts of up to 90% compared to On-Demand pricing. They're ideal for fault-tolerant, stateless workloads and experience interruptions less than 5% of the time on average.
Start by calculating your baseline usage and applying Savings Plans or Reserved Instances to cover that portion. Then, use On-Demand or Spot pricing for peak demand. This approach ensures a more accurate and cost-effective projection.
Use AWS Pricing Tools
AWS offers tools to help refine your cost estimates based on your scaling models. The AWS Pricing Calculator is a great starting point. It comes in two versions: a public version for quick estimates and an in-console version for detailed modeling. The in-console calculator is particularly handy as it allows you to import historical usage data and apply any specific discount rates tied to your AWS agreements.
These tools are free for AWS customers [24, 27]. For more detailed planning, you can use billing scenarios to model changes across your entire consolidated billing family. Management accounts can create up to five free bill estimates per month, with additional estimates costing $2.00 each.
To build an accurate estimate, import historical data to fine-tune your projections [24, 29]. Make sure to include details like your AWS Region, instance types, and quantities based on your scaling simulations. Don’t forget to factor in data transfer and storage needs, such as EBS volume sizes and snapshot retention, as these can significantly affect your overall costs [25, 32].
The calculator assumes each month has 730 hours (365 days × 24 hours ÷ 12 months) and normalizes weekly patterns to about 4.34 weeks per month. Use the "Show Calculations" feature to see the detailed math behind your estimates, including breakeven points and utilization summaries.
The "Groups" feature lets you compare different scaling strategies, like "Peak Season Scaling" versus "Baseline Scaling." You can also export your estimates in CSV, PDF, or JSON formats for sharing or further analysis [26, 27, 28]. For large-scale environments, the Pricing Calculator API is a powerful tool. It allows you to programmatically generate cost estimates, making it easier to model multiple scenarios or integrate forecasting into your automation workflows [24, 29].
Step 4: Add Predictive Scaling Forecasts
Incorporate predictive scaling forecasts to prepare for future demand spikes. Unlike reactive scaling, which adjusts based on current load, predictive scaling uses machine learning to estimate capacity needs for the next 48 hours.
AWS provides two key forecasts that are crucial for your cost models: LoadForecast and CapacityForecast. The LoadForecast predicts anticipated demand using metrics like CPU usage or request count, while the CapacityForecast estimates the number of instances needed to meet that demand while maintaining your target utilization. These forecasts refresh every six hours and offer an hourly breakdown of required capacity.
You can test these policies in "forecast only" mode through the AWS console. This allows you to evaluate the potential cost and performance impacts without initiating scaling actions. For example, you might create policies with different target utilization rates - like 40% CPU versus 60% CPU - and compare their forecasted costs. This exercise reveals how lower target utilization increases availability but also raises the number of forecasted instances and overall costs. These insights help fine-tune your forecast inputs, setting the stage for validation.
To ensure forecast accuracy, monitor the Mean Absolute Percentage Error (MAPE) using CloudWatch metric math. MAPE identifies when forecasts overestimate capacity, which could lead to unnecessary expenses. As Ankur Sethi, Sr. Product Manager for EC2, explains:
Because predictive scaling can only increase capacity, it is useful to alert when policies over-forecast capacity, avoiding wasteful spending.
Setting up CloudWatch alarms based on MAPE allows your finance or DevOps teams to catch inaccuracies before they affect your budget.
For events that historical data might not account for - like product launches or marketing campaigns - use scheduled actions to manually override forecasts and ensure sufficient capacity. Additionally, the GetPredictiveScalingForecast API enables you to export capacity forecasts directly into financial planning tools or spreadsheets, making it easier to integrate these estimates into your budgeting process.
Step 5: Monitor, Validate, and Refine Forecasts
Once you've modeled and calculated costs, the next step is to keep a close eye on your forecasts. Regular monitoring and adjustments are key to maintaining accurate budgets and efficient scaling policies.
Set Up Monitoring and Alerts
Start by configuring CloudWatch alarms to track the accuracy of your predictive scaling. Use CloudWatch metric math to calculate the Mean Absolute Percentage Error (MAPE), a common way to measure forecast accuracy. If MAPE shows a decline in accuracy, these alarms will alert you, so you can adjust your scaling policies as needed.
The Amazon EC2 Auto Scaling console offers helpful visual tools, including "Load" and "Capacity" graphs. These graphs compare observed data with predicted values, making it easier to assess how well your policies are performing. Additionally, the "Availability impact" and "Cost impact" columns provide quick insights into whether your scaling policies are balancing workloads effectively without leading to over-provisioning.
Validate Forecasts with AWS Cost Explorer
To ensure your forecasts align with actual spending, use AWS Cost Explorer. This tool provides an 80% prediction interval, which accounts for historical volatility and helps you set realistic expectations. Cost Explorer updates its data at least once every 24 hours and can forecast spending up to 18 months in advance, using the last 13 months of historical data.
If you notice discrepancies in your forecasts, the "Generate forecast explanation" feature can provide natural-language insights into the causes. For example, it might highlight seasonal trends or changes in specific services that are influencing your costs. To stay ahead of potential overspending, set up AWS Budgets with alerts triggered by forecasted spending rather than actual spending. This gives you time to implement cost-saving measures before issues arise. For even more precise validation, adopt a tagging strategy to track costs by business unit or project, ensuring you can pinpoint scaling-related expenses.
By refining your forecasts, you set the stage for leveraging automation tools that can take cost optimization to the next level.
Use Automated Cost Optimization Tools
Manually refining forecasts can be time-consuming, especially when you're juggling multiple tools and metrics. That's where automation comes in. Opsima is one such tool that simplifies AWS cost optimization by automating commitment decisions. It ensures you're always getting the lowest effective rate for dynamically scaling resources, without requiring infrastructure changes or direct access to your data. Opsima supports services like EC2, ECS, Lambda, RDS, ElastiCache, and OpenSearch, and can cut AWS bills by up to 40% [https://opsima.ai].
What sets Opsima apart is its adaptability. It automatically adjusts commitments as your usage patterns evolve, preserving flexibility while reducing costs. Plus, with a 15-minute onboarding process and a no-strings-attached cancellation policy, it saves your team the effort of manually monitoring and refining forecasts, freeing up engineering time for other priorities.
Conclusion
To effectively forecast AWS costs for dynamic scaling, follow this five-step framework: review historical data, model scaling behaviors, calculate costs, incorporate predictive forecasts, and continuously monitor usage. By adopting these practices, many organizations have reported 20-40% reductions in their overall cloud spending.
However, creating an accurate forecast is just the beginning. The real challenge lies in keeping those forecasts accurate as workloads evolve. Cloud costs can change by the hour, making traditional fixed budgets unreliable. This is why ongoing validation is so important. Regularly comparing your forecasts to actual spending helps you catch discrepancies early, allowing you to refine your models before small issues turn into major expenses.
Manual monitoring, though effective, can drain valuable engineering resources. That’s where Opsima comes in - it automates commitment management, ensuring you pay the lowest possible rates without making changes to your infrastructure. Supporting key AWS services like EC2, Lambda, RDS, and ElastiCache, Opsima adjusts as your usage evolves, maintaining the flexibility that makes dynamic scaling so appealing.
FAQs
How does predictive scaling help forecast AWS costs more accurately?
Predictive scaling takes AWS cost management to the next level by automatically adjusting resource capacity based on anticipated demand. Unlike reactive scaling - which kicks in only after a demand change - predictive scaling analyzes historical data to spot patterns, such as daily or weekly usage trends. With this insight, it can forecast capacity needs up to 48 hours ahead and refresh these predictions every six hours for improved precision.
This approach ensures resources are better aligned with expected workloads, helping businesses avoid over-provisioning during low-demand periods or under-provisioning when demand surges. The result? Lower unnecessary costs and smoother operations. For companies aiming to optimize their AWS budgets, predictive scaling offers a smarter way to balance resource efficiency and cost control.
What are the best tools for tracking and improving AWS cost forecasts?
To keep AWS cost forecasts accurate and manageable, several tools can help you stay ahead. Amazon CloudWatch plays a vital role in monitoring predictive scaling. It visualizes historical data, measures the accuracy of your forecasts, and sends alerts for any unexpected changes in performance. This way, you can quickly spot trends or deviations in your cost estimates.
Another must-have is AWS Cost Explorer, which lets you create detailed forecasts based on past usage. It’s a great way to analyze your spending habits and fine-tune predictions as needed. On top of that, AWS offers financial management solutions that include dashboards, anomaly detection, and optimization features, all designed to refine your cost tracking and forecasting.
By combining these tools, you can ensure your AWS costs are not only well-forecasted but also monitored and adjusted over time. This approach helps you maintain control over cloud spending while meeting the demands of dynamic scaling.
How do Savings Plans and Spot Instances impact AWS cost forecasting?
Savings Plans and Spot Instances are essential tools for cutting AWS costs and improving the accuracy of your cost forecasts.
Savings Plans allow you to commit to a consistent amount of usage, automatically applying discounts to eligible services. These plans can lower your costs by as much as 72%, making them a great option for steady workloads. With their predictable pricing, they simplify cost estimation and help you plan your budget more effectively.
On the other hand, Spot Instances let you tap into unused AWS capacity at discounts of up to 90%. They're a perfect fit for tasks that can tolerate interruptions, such as batch processing or testing environments. However, since their availability isn't guaranteed, it's important to factor in potential interruptions when forecasting costs.
By combining these two options strategically, you can fine-tune your cost predictions while keeping your AWS expenses in check. This approach not only helps you save money but also ensures better planning and resource allocation.